
B2B Product Pricing Insights - August 2026
Stay ahead in B2B product pricing with easy‑to‑read insights on currency, freight and commodity market trends
August 2026: Energy, Risk and the Road to 2027
Welcome to the August edition of B2B Product Pricing Insights.
Last month we forecast that July and August would set the tone for the pricing environment until 2027. One month in, the lack of resolution to the Iran Crisis is ensuring energy based inflation continues to embed across multiple indices. Energy pricing’s remains the most significant influence on manufacturing and distribution costs. Therefore, in general, to mitigate that reality requires pressure to ensure mutual focus on efficiency, supply chain, specification and sourcing. However, it is important to not let a broad brush market view dominate the specifics of any negotiation.
Key Headlines
- Energy is generating price pressure across the supply-chain
- Direct costs: UK Gas and Electricity prices hit 3 year highs in July.
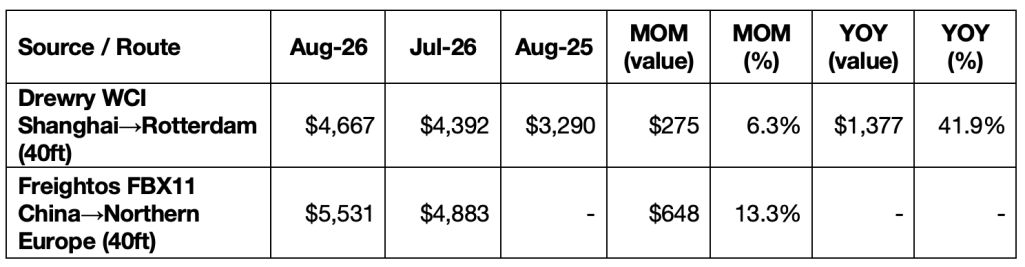
- Freight: UK TEG Index reached an all-time high, and container rates are +40% YoY.
- Raw Materials: Rubber and Cotton, both closely linked to oil prices, are +25% YoY.
- Efficiency is a key marginal gain
- Product availability: Maximising ‘on time and in full’ performance helps control freight costs.
- Volume: Strong forecasting, planning and order volumes support manufacturing and logistics efficiency.
- Product specification: Standardisation, simplification, and presentation of goods all enhance competitiveness.
- Looking forward
- The impact of UK and EU new steel tariffs will become visible as the first quarter of implementation closes in September.
- The El Niño weather system is increasingly referenced on inflationary forecasts for food commodities.
Currency
Summary
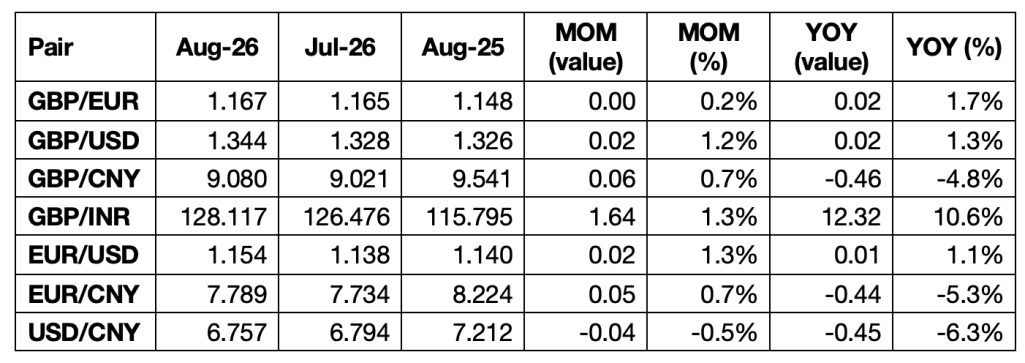
The continued uncertainty over the Iran crisis and the higher global inflation risk has put most major interest rates into a holding pattern. The combination of global risk factors and common interest rate policy positions create a more stable exchange rate environment. The exception is India, where local factors continue to allow slow depreciation. Markets forecasts remain unsure on if, or when, that will be addressed by the Reserve Bank of India.
Freight
China > Northern Europe
China > Northern Europe Summary
- After a mid-July peak rates eased into August. From the start of August last year, rates declined for 10 weeks; this year, carriers are using with blank sailings and price increase notifications to try and hold rates as seasonal demand reduces.
- August is the peak of the typhoon season so expect some shipment delays especially, in southern China ports.
Inland Freight
Inland Freight Summary
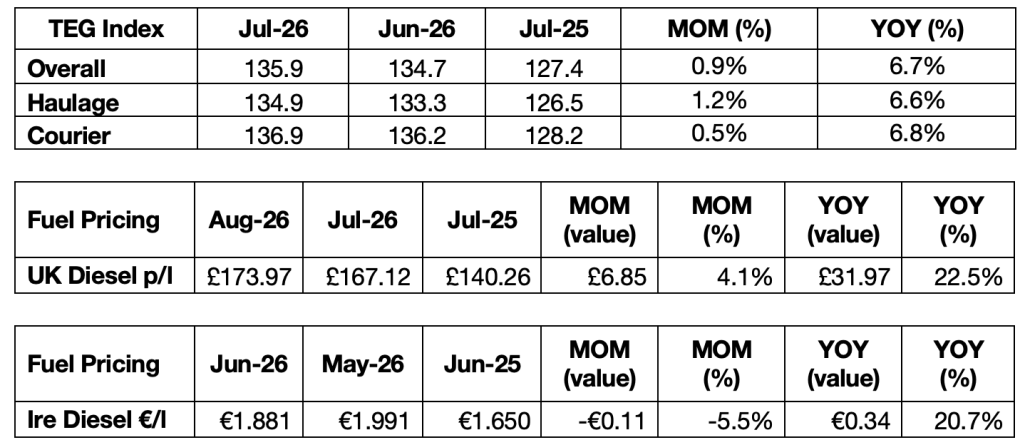
- UK TEG index: TEG reported a new all-time high with fuel volatility, strong retail volume numbers and a balanced picture on availability.
- UK and Ireland diesel pricing continues to be volatile with the Iran crisis and on-off process on peace.
- The UK 12 month HGV vehicle excise tax holiday started in July.
Commodities
Summary
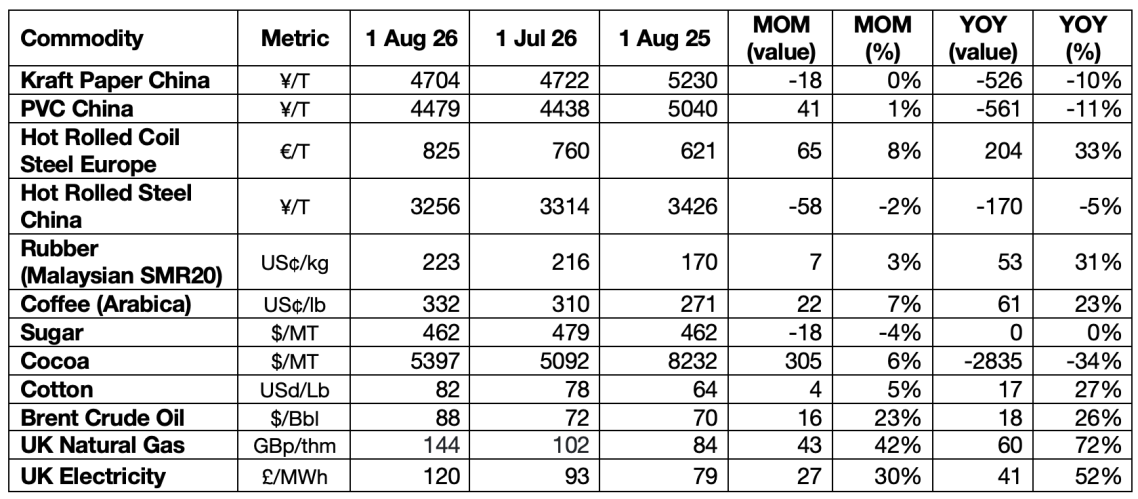
- Packaging: Sustained weaker demand and over capacity are keeping prices soft.
- PVC: The structural market challenges in China remain and short term pricing is moving down rather than up.
- Steel: Steel into the EU jumped in July as the result of a new tariff-rate quota regime; the new regime cut quotas and doubled outside quota import tariffs by 50%. This is the first phase of EU action and consultations have started to expanding the scope. The UK has implemented a similar policy aligned with the EU. There is a concern that local finished goods manufacturers are disadvantaged against finished goods imports.
- Rubber: Higher prices remain with mixed market signals (low tyre demand but El Niño seasonal concerns) and complicated by oil price fluctuations.
- Food commodities: Are reflecting market specific events and forecasts.
- Cotton: Pushing higher alongside fluctuating with oil market tensions.
- UK Energy: Gas and electricity prices reached their highest prices since Q1 2023. UK storage is currently 22% below last year and with more limited capacity making the UK more exposed to future market shocks. Global Energy Flow reported that current gas storage levels are 11-12% below the 5 year average and the EU has relaxed its minimum storage target from 90% to 80%. Energy pricing remains the biggest commodity risk to B2B product pricing during H2.

Producer Pricing
Summary
Producer input prices eased but remain high and that pressure continues to push output prices higher. This creates efficiency, overhead and purchasing challenges for manufacturers.
- UK: Producer input prices (7.3%) continue to outstrip output prices (3.5%). With oil pricing dominating the UK producer pricing trend.
- Euro area: A one-off drop in May 2025 helped create the jump in % change for May. The slow data release from the EU means relevance to pricing in August is challenging in the current volatile market.
- Ireland is distorted by the scale of the Multinationals in the Pharma and ICT sectors. More relevant is the Irish wholesale price changes that state Manufacturing producer prices were 3.5% higher YoY in June 2026. https://www.cso.ie/en/statistics/prices/wholesalepriceindex/
- China: Inside the significant change to a 4.1% YoY growth was a 0.1% decline in the category Manufacturer of Paper and Paper Products. This is the result of falling pulp prices and overcapacity.
- US: Energy (23%), and Transport and Warehousing Services (13.9%) are both driving YoY producer inflation in the US.
Consumer Inflation
Summary
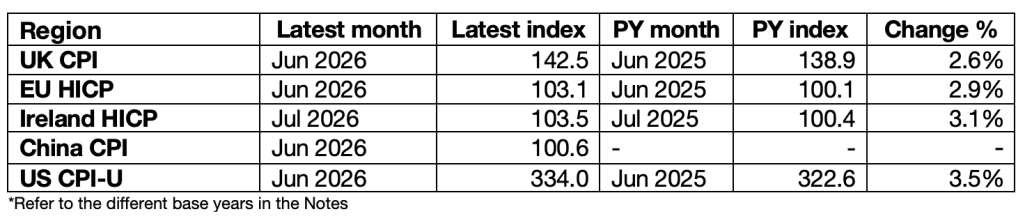
This data is a largely irrelevant for product cost pricing but is often a datapoint referenced in price negotiations, therefore, worth tracking.
- UK: Goods inflation fell from 2.0% to 1.7%. Clothing and Footwear, and Furniture and Household Goods both deflationary categories in the last 12 months.
Final Thoughts
The risk and uncertainty in the market have continued into the start the 2027 budget process. This creates a dilemma: how much risk an organisation is willing to carry, and how effectively it can respond (internally and contractually) to market movements. These factors directly influence how much risk is priced in, making pricing decisions significantly more complex. It is worth considering how open you are with stakeholders about risk, and the trade off between pricing certainty over time and the premium required to secure it.
A second trend that it would be positive to see addressed during this period is the gap between contract and branded products. Overall, that gap has grown too large in recent years, and this period could see a realignment with brands holding their competitive position as contract lines (more susceptible to cost pressure) rise. If this shift delivers a better sales balance, it would be a positive to the overall industry.
Stay connected and stay informed. Subscribe to the monthly newsletter and follow on LinkedIn to stay ahead of the pricing and supply‑chain dynamics shaping the market.
Author: Simon McLoughlin
Notes
- Refer to source data for full data methodology
- Currency taken from the first day of the month or the first published date of the month. Data should never be used for currency transactions or commercial agreements.
- Freight indices are taken as per the 1st of the month
- The Drewry Index is a better guide to spot rates and Freightos for contract rates.
- The tracked cost is the container shipping price in dollars and does not include UK clearance and freight costs to a final destination.
- TEG Index base Jan 2019
- UK fuel pricing is Retail pricing published weekly by the UK government, data taken as per the 1st of the month.
- Irish fuel pricing is Retail pricing published by the Irish Central Statistics Office.
- Commodity data is taken as per 1st of the month, when that data is not available the last available data is included.
- The Steel data for China is Hot Rolled and for Europe is Hot Rolled Coil which is a form of Hot Rolled Steel usually used in Business Supplies products
- UK PPI base 2015; EU PPI base 2021; China PPI base Same Month Last Year; US PPI base 2009
- UK CPI base 2015; EU HICP base 2025; Ireland HICP base 2025; China CPI base 2025; US CPI base 1982-84 (with exceptions)
Sources
Bank of England; ECB: Reference Rates; US Federal Reserve; GOV.UK; Central Statistics Office, Ireland; Eurostat; Federal Reserve Bank of St Louis – FRED; National Bureau of Statistics China; Drewry: World Container Index (Shanghai→Rotterdam); Freightos: FBX11 China→Northern Europe; TEG.tech: TEG Index; Trading Economics; London Metal Exchange; MacroMicro; Moodys; S&P Global; Sunsirs
Disclaimer
The content in this newsletter is obtained from sources believed to be accurate and reliable. The information is for general informational purposes only and does not constitute professional advice. B2B Product Consultancy Ltd assumes no responsibility or liability for errors or omissions in this content or for any actions taken based on the information provided.